Accessing the results
There are several ways to get at the results. The simplest is that we can simply get back a list of dicts:
results = lab.results()
results now contains a list, each element of which is a results dict. A results dict is a Python dict that’s structured in a particular way. It contains three top-level keys:
Experiment.PARAMETERS, which maps to a dict of the parameters that were used for this particular run of the experiment (xandyin our case, each mapped to a value taken from the parameter space);Experiment.RESULTS, which maps to a dict of the experimental results generated by theExperiment.do()method (resultin our case); andExperiment.METADATA, which contains some metadata about this particular experimental run including the time taken for it to execute, any exceptions raised, and so forth. The standard metedata elements are described inExperiment: sub-classes can add extra metadata.
A list isn’t a very convenient way to get at results, and analysing an
experiment typically requires some more machinery. Many experiments
will use pandas to perform analysis, and the lab can generate a
pandas.DataFrame structure directly:
import pandas

df = lab.dataframe()
The dataframe contains all the information from the runs: each row
holds a single run, with columns for each result, parameters, and
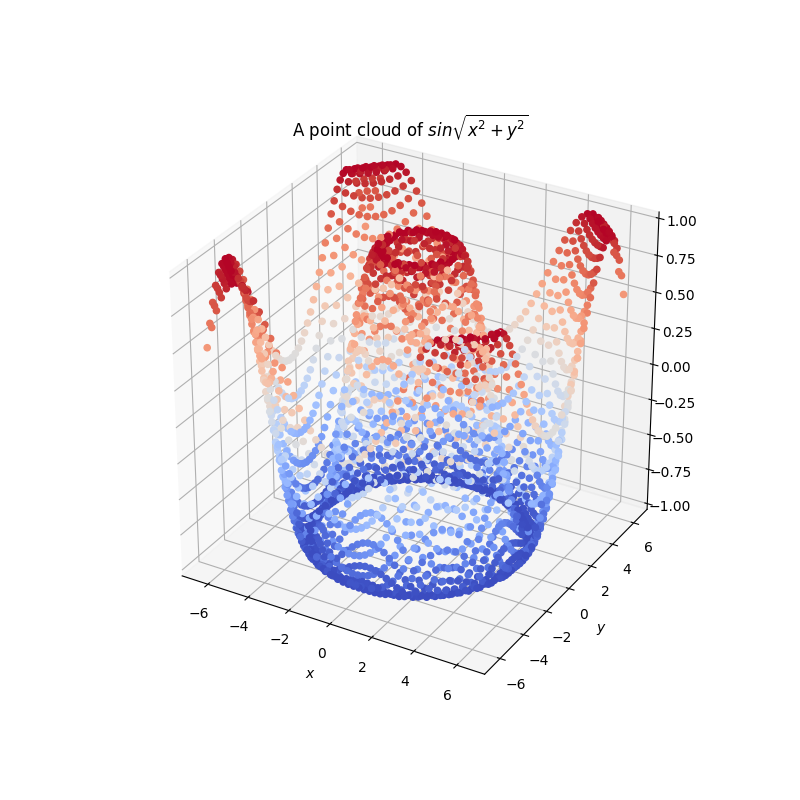
metadata element. We can now do anaysis in pandas as appropriate:
for example we can use matplotlib to draw the results as a point
cloud:
import matplotlib
from mpl_toolkits.mplot3d import Axes3D
from matplotlib import cm
import matplotlib.pyplot as plt

fig = plt.figure(figsize = (8, 8))
ax = fig.add_subplot(projection = '3d')

ax.scatter(df['x'], df['y'], df['result'],
           c=df['result'], depthshade=False, cmap=cm.coolwarm)
ax.set_xlim(numpy.floor(df['x'].min()), numpy.ceil(df['x'].max()))
ax.set_ylim(numpy.floor(df['y'].min()), numpy.ceil(df['y'].max()))
ax.set_zlim(numpy.floor(df['result'].min()), numpy.ceil(df['result'].max()))

plt.title(lab.notebook().description())
ax.set_xlabel('$x$')
ax.set_ylabel('$y$')

plt.show()